Every industrial asset undergoes a degradation process from the moment it begins operating. However, the initial signs of damage don't appear suddenly—there's a lag time between the onset of degradation (Potential Failure) and functional failure (Functional Failure). The D–I–P–F (Design – Installation – Potential Failure – Functional Failure) curve illustrates this journey and forms the basis of predictive maintenance strategies.
By understanding the position of various monitoring techniques such as Oil Analysis, Electrical Signature Analysis (ESA), and Vibration Analysis, companies can identify damage early, improve asset reliability, and reduce downtime costs.
Stages in the D–I–P–F Curve
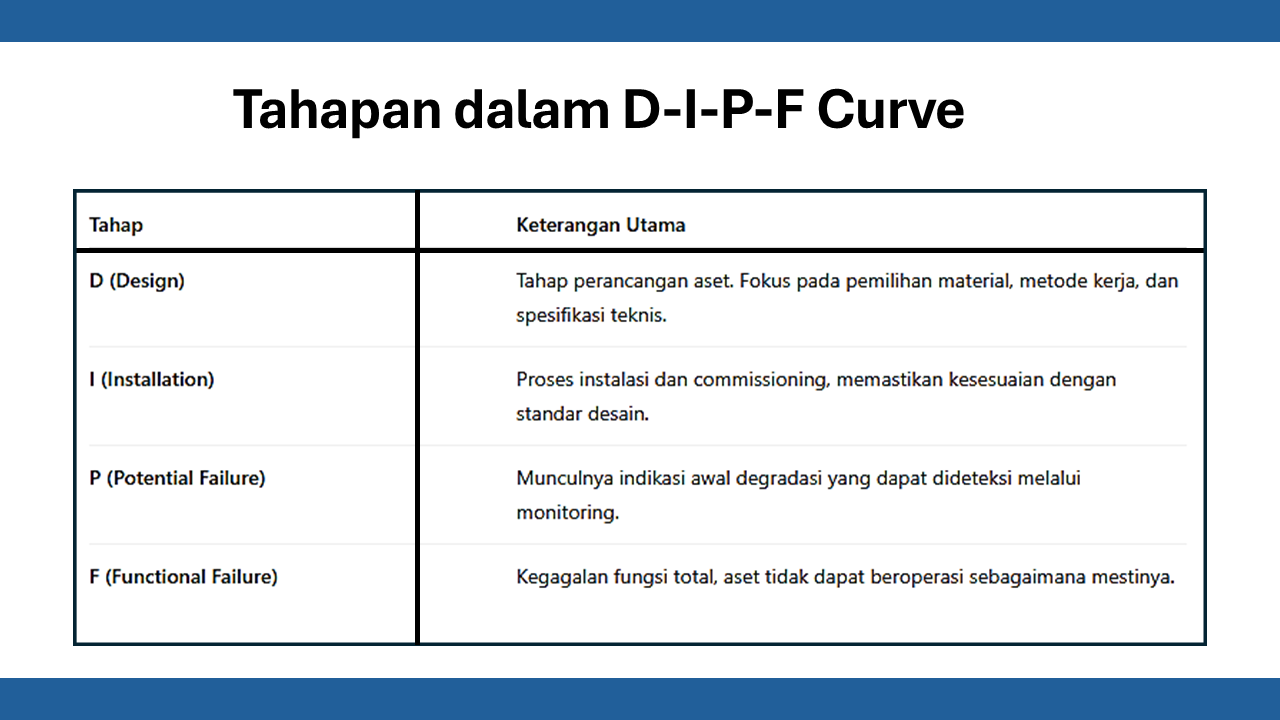
Between P and F lies the P–F Interval, which is the time available to detect, analyze, and take corrective action before total failure occurs.
1. Oil Analysis
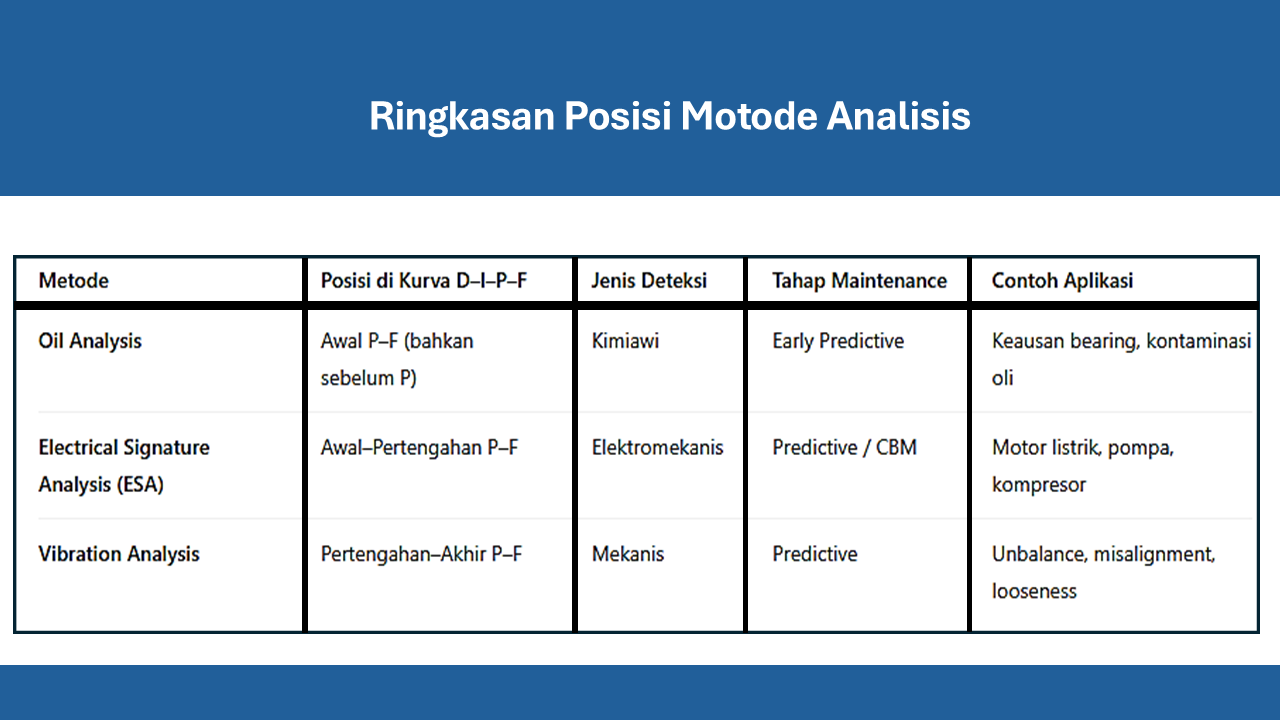
Position: Beginning of the P–F Interval (or even slightly before point P).
Functions and Characteristics:
- Detects contamination, lubricant degradation, oxidation, and metal wear particles.
- Is the earliest indicator of internal damage such as bearing, gear, or hydraulic system wear.
- Provides signals long before physical symptoms (vibration, heat, or sound) appear.
Example: Increased Fe or Cu content in oil indicates internal wear on metal components.
Conclusion: Oil analysis plays a very early role in early detection and is crucial in extending the P–F interval.
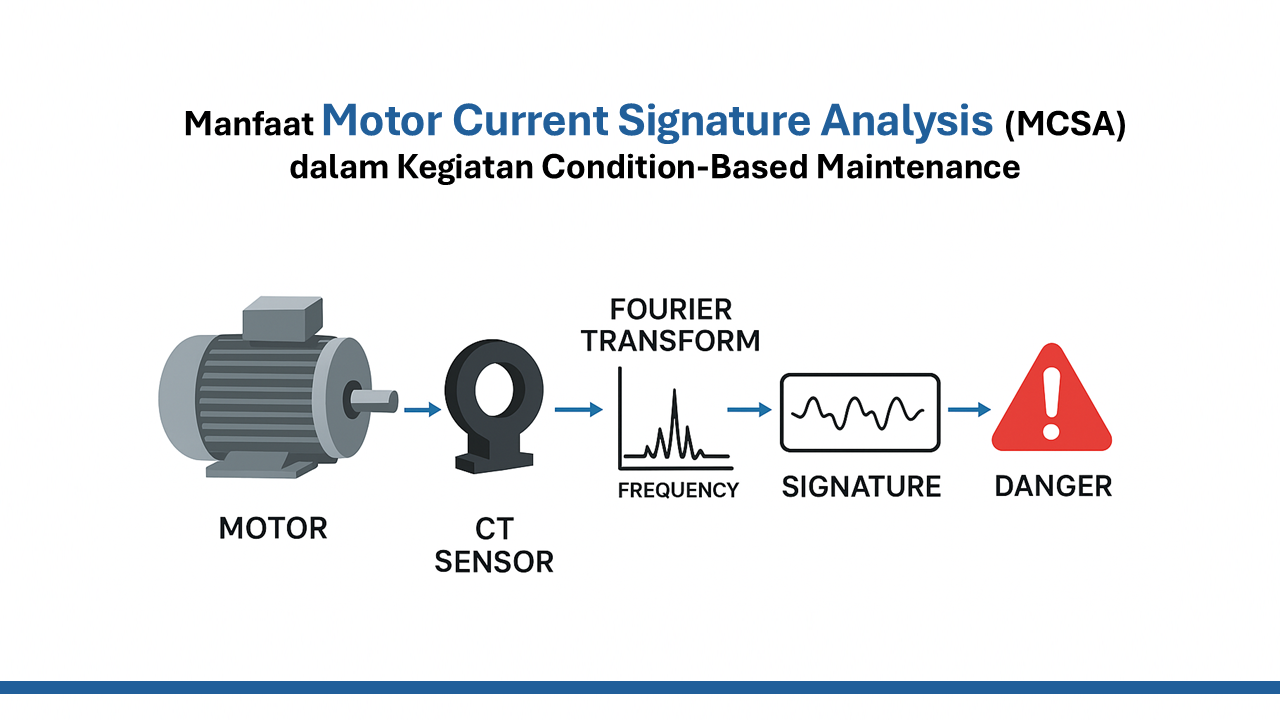
2. Electrical Signature Analysis (ESA)
Position: Early to Mid P–F Interval.
Functions and Characteristics:
- Analyzes electric motor current and voltage signals to detect:
• Load imbalance,
• Rotor/stator problems,
• Bearing degradation,
• Clutch or load problems.
ESA is capable of detecting electromechanical anomalies even before vibration increases significantly. Suitable for electric motor, pump, fan, and compressor systems.
Example: Changes in motor phase current patterns indicate rotor bar damage or load imbalance.
Conclusion: ESA is highly effective in the early to mid-stages of degradation, as a core component of electrical signal-based Predictive Maintenance.
3. Vibration Analysis
Position: Mid to Late P–F Interval.
Functions and Characteristics:
- Used to detect imbalance, misalignment, looseness, bearing defects, and other mechanical damage.
- Vibration symptoms usually appear after the damage has progressed to a significant mechanical level.
- Vibration analysis is effective for verifying physical conditions following indications from Oil Analysis or ESA.
Example: The vibration spectrum shows typical bearing frequencies → signs of spalling or raceway damage.
Conclusion: Vibration analysis is the primary confirmation tool that indicates damage that is already severe but can be addressed before functional failure occurs.
Summary of Analysis Method Positions
Integration and Strategy
The combination of these three methods creates a multi-tiered detection layer:
- Oil Analysis provides early signals (chemical indications).
- ESA confirms electromechanical changes.
- Vibration Analysis validates the final physical condition.
By implementing this integrated strategy, organizations can:
- Improve asset reliability,
- Optimize predictive maintenance schedules,
- Reduce downtime and unscheduled repair costs.
Final Conclusion
In the context of the D–I–P–F Curve:
- Oil Analysis → detects early symptoms,
- ESA → detects early electromechanical changes,
- Vibration Analysis → detects advanced mechanical symptoms before failure.
These three complement each other to create an effective, efficient, and data-driven Predictive Maintenance approach.